文章目录
pgCluu是一款PostgreSQL的新能监控和审计工具,遵循PostgreSQL Licence,近似与BSD和MIT的一个Licence,对商业使用友好。本文将从源码编译安装pgCluu,并试用该工具做PostgreSQL的性能监控。
pgCluu的托管在github上,其项目主页在这里,也可以使用git clone从仓库克隆该项目。
1 2 3 4 5 6
| [postgres@anzhy Downloads]$ git clone https://github.com/darold/pgcluu.git Initialized empty Git repository in /home/postgres/Downloads/pgcluu/.git/ remote: Counting objects: 807, done. remote: Total 807 (delta 0), reused 0 (delta 0) Receiving objects: 100% (807/807), 958.99 KiB | 14 KiB/s, done. Resolving deltas: 100% (529/529), done.
|
如果是用于生产使用,还是建议去下载稳定的release版本,在这里有下载,本文使用的是2.1稳定版本。
然后就是和大多数linux软件一样,开始做make & make install,pgCluu比较特别的地方是,没有用configure生成Makefile,而是用一个perl脚本来生成。
1 2 3 4 5 6 7 8 9 10 11 12 13 14 15 16
| [postgres@anzhy pgcluu-2.1]$ perl Makefile.PL Checking if your kit is complete... Looks good Writing Makefile for pgCluu [postgres@anzhy pgcluu-2.1]$ make cp pgcluu_collectd blib/script/pgcluu_collectd /usr/bin/perl -MExtUtils::MY -e 'MY->fixin(shift)' -- blib/script/pgcluu_collectd cp pgcluu blib/script/pgcluu /usr/bin/perl -MExtUtils::MY -e 'MY->fixin(shift)' -- blib/script/pgcluu Manifying blib/man1/pgcluu.1 [postgres@anzhy pgcluu-2.1]$ sudo make install [sudo] password for postgres: Installing /usr/local/share/man/man1/pgcluu.1 Installing /usr/local/bin/pgcluu_collectd Installing /usr/local/bin/pgcluu Appending installation info to /usr/lib64/perl5/perllocal.pod
|
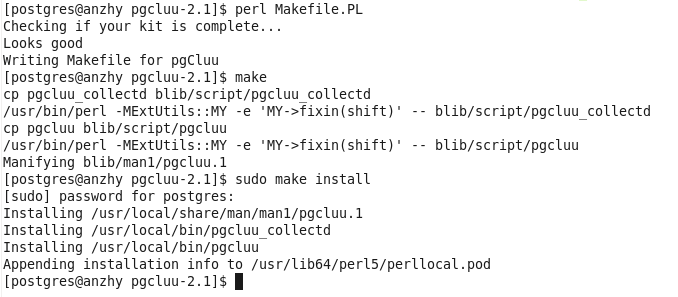
默认情况下,pgcluu和pgcluu_collectd这两个程序安装在/usr/local/bin目录下,两个程序都是用perl写的。
要测试PostgreSQL的性能,为了能看到明显一些的结果,要给数据库加一些压力,本文采用之前的文章用pgbench的初始化方式,给数据库加一些DML和DDL操作的压力。命令如下,
1 2 3 4
| for (( i = 0; i < 8; i++)); do time pgbench -i --unlogged-tables -s 16 -U postgres -p 5432 -d pgbench; done;
|
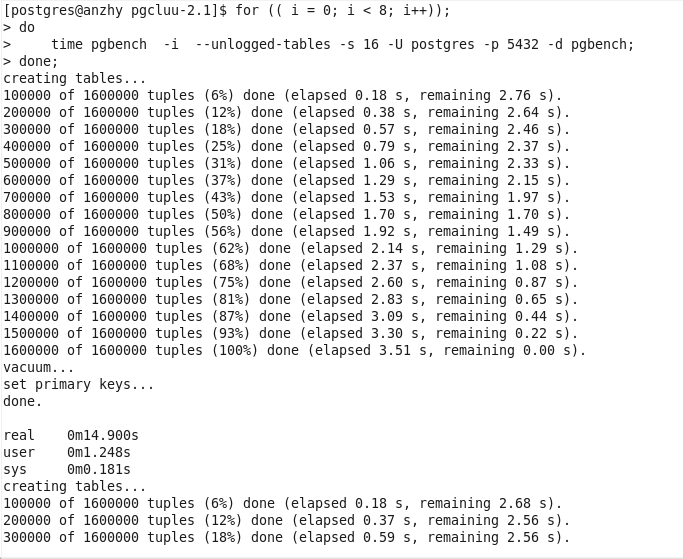
以上命令中,测试用的数据库名是pgbench。为了可以持续增加数据库压力,对数据库反复执行了8次初始化,每次初始化的时间大约在15~20s(在我的测试机器上),因此数据库繁忙的时间总共大约有120~160s。
然后建立收集数据的目录,并开始收集数据库的性能数据,
1 2 3 4 5 6
| [postgres@anzhy ~]$ mkdir /tmp/stat_db1/ [postgres@anzhy ~]$ pgcluu_collectd -D -i 30 /tmp/stat_db1/ -h localhost -U postgres -d pgbench LOG: Detach from terminal with pid: 13352 [postgres@anzhy ~]$ pgcluu_collectd -k OK: pgcluu_collectd exited with value 0 [postgres@anzhy ~]$
|
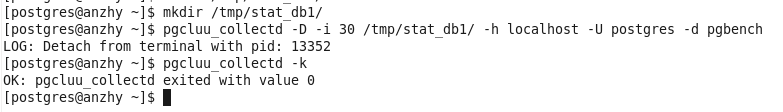
上述参数中,-D表示后台运行;-i 30表示30秒收集一次数据;/tmp/stat_db1/是收集数据保存的目录;其他参数表示数据库的地址,用户名和数据库名。由于程序在后台运行,如果需要结束程序需要使用-k参数,表示kill掉后台的pgcluu_collectd。本文采用的方式是另一种自动退出的方法,即-E 200表示程序运行200秒之后自动退出,如下,
1 2 3 4 5 6
| [postgres@anzhy ~]$ pgcluu_collectd -E 200 -i 30 /tmp/stat_db1/ -h localhost -U postgres -d pgbench *** pgcluu_collectd v2.1 (pid:8551) started at Thu Dec 4 21:27:06 2014 Type Ctrl+c to quit. sh: LC_ALL=C sar -t -p -A 1 1: No such file or directory
|
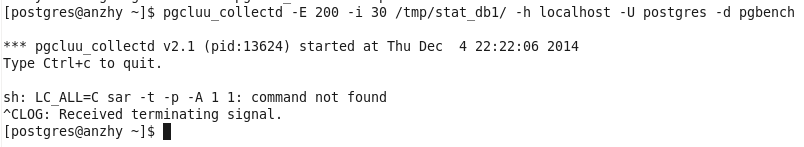
以上脚本确保可以收集到6(200/3)次数据,但是发现了错误,提示找不到sar命令,尝试了使用-s命令指定sar的位置,以及修改源代码,仍然不能解决。决定采用2.0版,重复上述操作,2.0版没有这样的问题,但是2.0版本没有提供-E参数,如下,
1 2 3 4 5 6
| [postgres@anzhy ~]$ pgcluu_collectd -i 30 /tmp/stat_db1/ -h localhost -U postgres -d pgbench *** pgcluu_collectd v2.0 (pid:13908) started at Thu Dec 4 22:29:24 2014 Type Ctrl+c to quit. ^CLOG: Received terminating signal.
|
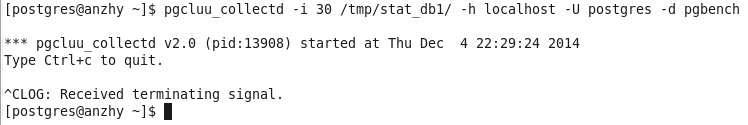
此次收集正常,运行一段时间后Ctrl+C退出。接下来就可以用pgcluu做报表了,一般的报表呈现是使用html,就可以简单的使用默认参数即可,如下,
1 2 3 4 5 6 7 8 9 10 11 12 13 14 15 16
| [postgres@anzhy ~]$ rm -rf /tmp/report_db1/ [postgres@anzhy ~]$ mkdir /tmp/report_db1/ [postgres@anzhy ~]$ pgcluu -o /tmp/report_db1/ /tmp/stat_db1/ [postgres@anzhy ~]$ ls /tmp/report_db1/ bootstrap.min.css pgbench-index-scan.html postgres-table-size.html system-device0.html bootstrap.min.js pgbench-index-size.html regression-index-scan.html system-device1.html cluster.html pgbench-missing-index.html regression-index-size.html system.html database-pgbench.html pgbench-statio-table.html regression-missing-index.html test-index-size.html database-postgres.html pgbench-table-indexes.html regression-redundant-index.html test-table-indexes.html database-regression.html pgbench-table-kind-tuples.html regression-table-indexes.html test-table-kind-tuples.html database-test.html pgbench-table-query-tuples.html regression-table-kind-tuples.html test-table-query-tuples.html font-awesome.min.css pgbench-table-size.html regression-table-query-tuples.html test-table-size.html index.html pgbench-table-vacuums-analyzes.html regression-table-size.html test-table-vacuums-analyzes.html jquery.min.js pgcluu.css regression-table-vacuums-analyzes.html network-device0.html pgcluu.js regression-unused-index.html network-device1.html postgres-index-size.html sorttable.js
|
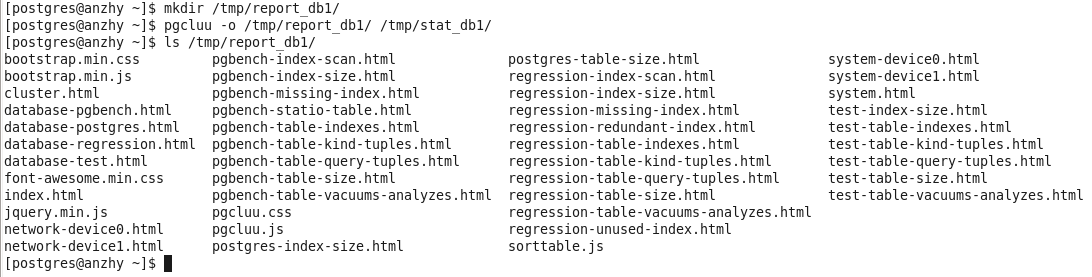
生成的报表直接用浏览器打开即可,主入口是index.html,以下列举几张图,
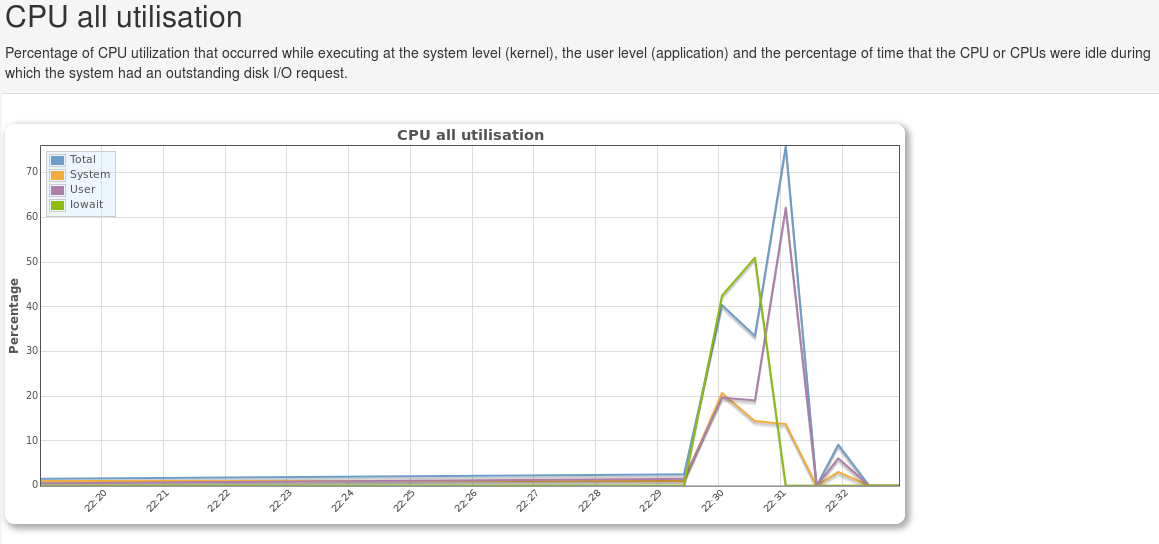
这个是CPU使用情况的图,可以看到系统突然有一个激增,这是开始做初始化的时候。
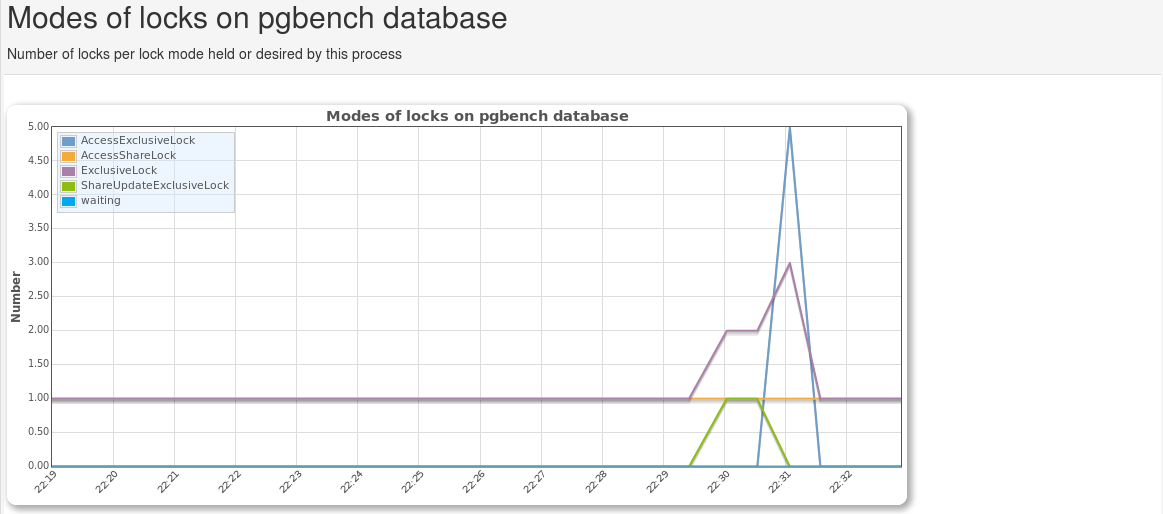
这个是各个种类锁争用的情况,也是突然有一个激增。
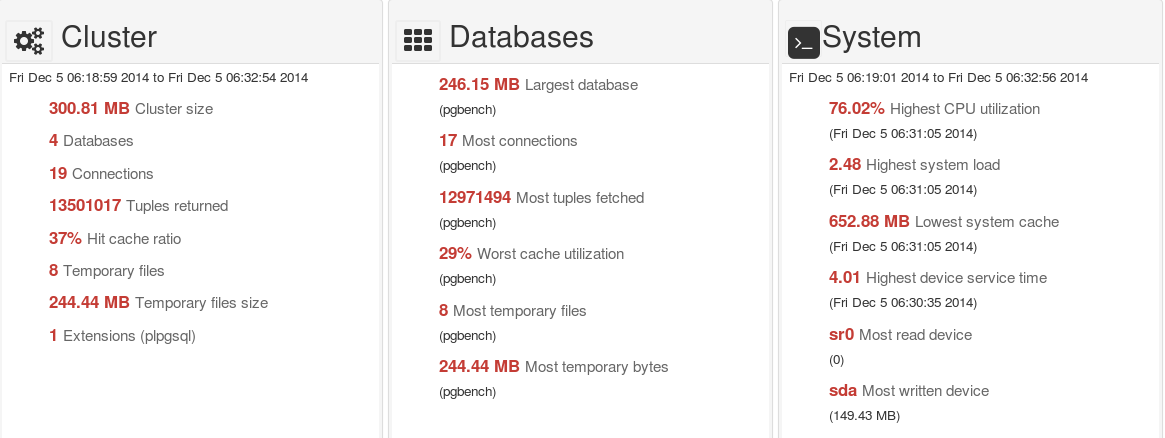
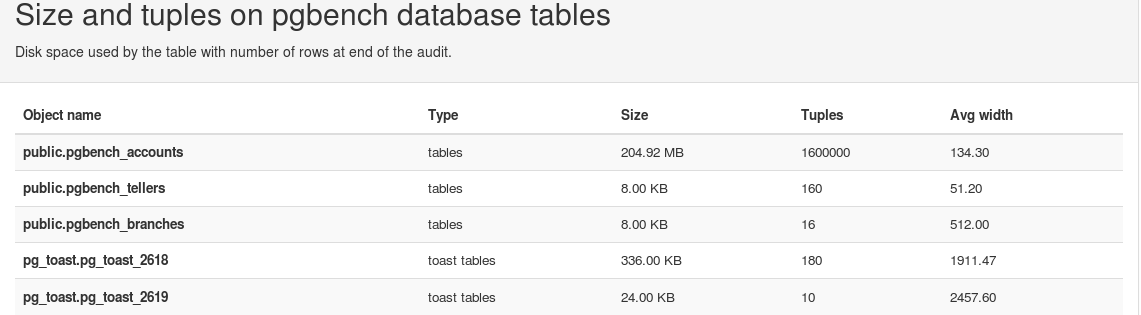
除去动态信息的图表,pgcluu也收集了静态信息,如上图中,首页上的概要数据汇总,和数据库分页下数据库大小的数据等等。
以上是pgCluu的使用简述。本文的操作主要参考官方代码中的Readme。